
Bid win rate analysis is the practice of calculating and segmenting how often your team bids on opportunities and how often it wins them, using both count-based and pipeline-amount-weighted formulas. Your two immediate next steps: pick a 12-month analysis window, then compute both your count-based win rate (wins ÷ (wins + losses)) and your pipeline-amount win rate (won pipeline value ÷ total decided pipeline value) for the same period. Running both together is what separates a real diagnostic from a vanity metric.
- Bid rate (count): Number of bids submitted ÷ (bids submitted + no-bids)
- Win rate (count): Wins ÷ (wins + losses), per OpenAsset's RFP win rate guide
- Bid rate (amount): Total bid pipeline value ÷ (bid pipeline + no-bid pipeline)
- Win rate (amount): Won pipeline value ÷ (won + lost pipeline value)
- Immediate next step: Calculate all four figures for your last 12 months, then slice by incumbent vs. new client to find your biggest variance.
Pro Tip: Start with the incumbent vs. new client split. Most teams discover a significant percentage point gap between the two segments, and that single finding often drives the entire improvement roadmap.
Industry benchmark ranges for competitive public work are generally low percentage values, while negotiated work typically sits higher, according to ConstructConnect's expert guidance. If your count-based win rate looks healthy but your pipeline-amount win rate lags, you are winning small deals and losing large ones — a capture allocation problem, not a proposal quality problem.
Key Takeaways
Bid win rate analysis produces reliable, decision-grade signals only when you track both count-based and pipeline-amount-weighted rates across consistent periods and segments.
| Point | Details |
|---|---|
| Run both rate types | Calculate count-based and pipeline-amount win rates every period; divergence between them signals a deal-size allocation problem. |
| Segment by incumbent vs. new | This single split reveals the largest actionable variance for most BD teams and directly informs go/no-go thresholds. |
| Lock your analysis date | Use decision date, not submission date, to assign opportunities to periods and prevent denominator mismatches. |
| Audit data monthly | Assign one analyst to verify no-bid records, consistent pipeline fields, and duplicate IDs every month to keep rates reliable. |
| Rfpforgeai integrates analytics and proposals | The platform tracks win rates and generates compliant proposals in the same workflow, removing the manual handoff between analysis and execution. |
Table of Contents
- What are the exact formulas for bid win rate analysis?
- How should you set analysis periods and segments?
- How do you build bid/win rate tables and trended charts?
- How do you interpret results and run diagnostics?
- How do you improve your proposal win rate after analysis?
- Worked examples: count-based vs. pipeline-amount calculations
- What KPIs and dashboard layout should you track?
- What data quality issues bias bid win rate calculations?
- What experienced practitioners actually look at first
- Rfpforgeai puts your proposal analytics to work immediately
- Sources
What are the exact formulas for bid win rate analysis?
Bid rate and win rate each have two versions: count-based (every opportunity counts equally) and pipeline-amount-based (each opportunity is weighted by its dollar value). Deltek's Capture Analytics quick reference defines all four formulas and documents how trended rates are calculated across periods.
Count-based formulas
Bid rate (count) = Bids ÷ (Bids + No-Bids)
Win rate (count) = Wins ÷ (Wins + Losses)
No-bids are opportunities your team formally decided to pass on. They belong in the denominator of bid rate but not in win rate, because win rate measures only decided contests. Ties or split awards can be counted as 0.5 wins each, a convention drawn from winning percentage methodology when a clean win/loss binary is not available.
Pipeline-amount-based formulas
Bid rate (amount) = Sum of bid opportunity values ÷ (Sum of bid values + Sum of no-bid values)
Win rate (amount) = Sum of won opportunity values ÷ (Sum of won + lost opportunity values)
When an opportunity has multiple pipeline fields (e.g., "estimated value" vs. "contract ceiling"), choose one field and apply it consistently across every row. Changing the field mid-analysis creates a denominator mismatch that invalidates trend comparisons.
The Bid Rate Analysis Table documentation defines the exact column set analysts need: bid count, bid + no-bid count, bid amount, and bid + no-bid amount. Use those four columns as the template for any spreadsheet or BI table you build.
| Input Field | Count Method | Amount Method |
|---|---|---|
| Bids submitted | Count of records | Sum of pipeline values |
| No-bids | Count of records | Sum of pipeline values |
| Wins | Count of records | Sum of won values |
| Losses | Count of records | Sum of lost values |
| Bid rate output | Bids ÷ (Bids + No-Bids) | Bid $ ÷ (Bid $ + No-Bid $) |
| Win rate output | Wins ÷ (Wins + Losses) | Won $ ÷ (Won $ + Lost $) |
How should you set analysis periods and segments?
The right analysis window balances statistical stability against timeliness. A single month rarely contains enough decided opportunities to produce a reliable rate; quarterly windows are the practical minimum for most BD teams, and annual windows are best for benchmarking.
Choosing your analysis window
- Monthly: Use only for high-volume pipelines (50+ decided opportunities per month). Good for spotting sudden shifts, but noisy for small teams.
- Quarterly: The standard for most proposal teams. Enough volume for stable rates; short enough to catch mid-year drift. Omnicalculator's winning percentage guidance reinforces that small sample sizes produce unreliable rates and recommends aggregating to quarterly or annual windows.
- Annual (rolling 12-month): Best for benchmarking against industry standards and for year-over-year trend charts.
- Analysis date: Use the decision date (award or loss notification), not the submission date. Submission-date perioding misaligns rates when decision cycles are long.
Which segments to prioritize
Not all segments produce equally useful signals. Slice in this order:
- Incumbent vs. new client: Typically the widest variance and the most direct input to go/no-go decisions.
- Opportunity type (competitive sealed bid vs. negotiated vs. sole-source): Mixing these together makes your aggregate rate meaningless.
- Client/agency: Reveals relationship strength and where capture investment is paying off.
- Principal or project manager (PM): Identifies individual performance patterns and training needs.
- Source (proactive pursuit vs. reactive response): Proactive pursuits almost always win at higher rates; tracking the split tells you whether your pipeline is healthy.
- Organization or division: Useful for multi-division firms to allocate BD resources.
When an opportunity spans two periods (e.g., submitted in Q3, decided in Q4), always record it in the period of the decision date. Changing pipeline amounts after submission should not retroactively alter a prior period's amount-based rate; lock the value at decision time.
Pro Tip: *The PM-level segment is the one most teams skip, and it is often the most revealing.
How do you build bid/win rate tables and trended charts?
Building a reliable table takes five steps, in order. Skipping any step introduces the kind of inconsistency that makes your rates drift from period to period for no real reason.
- Choose your analysis period (monthly, quarterly, or annual) and lock the analysis date field to decision date.
- Select Count or Amount as your primary measure. Build both; display them as a toggle so reviewers can switch without rebuilding the table.
- Select the pipeline amount field you will use for all amount-based calculations. Document this choice in the table header so future analysts do not swap it.
- Group rows by your chosen attribute (client, PM, opportunity type, etc.). Each row shows bid count, bid + no-bid count, bid amount, bid + no-bid amount, win count, and win amount.
- Calculate rates in the final columns: bid rate (count), bid rate (amount), win rate (count), win rate (amount).
For trended charts, repeat steps 1–5 for each period in your range, then plot the rate outputs on a time axis. A quarterly trended win rate chart over eight quarters gives you enough data points to distinguish a real trend from noise.
The Count vs. Amount toggle matters because the two measures answer different questions. Count rate tells you about your team's decision-making discipline and execution consistency. Amount rate tells you whether you are allocating capture effort toward the deals that move revenue.
Exporting to Excel or BI tools: Include all six raw columns (bid count, bid + no-bid count, bid amount, bid + no-bid amount, win count, win amount) plus the four computed rate columns. Never export only the rates; without the raw inputs, downstream analysts cannot recalculate or audit the figures. Add a "period" column and an "attribute value" column so the export is pivot-ready.
Pro Tip: Add a "bid volume" column to every export. A rising win rate on falling bid volume is a warning sign, not a success story — it often means your team is cherry-picking easy wins while avoiding competitive work.
How do you interpret results and run diagnostics?
Numbers without questions are just decoration. When you pull your rates, run these diagnostic checks before drawing any conclusions.
Key diagnostic questions
- Is a low win rate concentrated in one client, one sector, or one PM — or is it spread evenly? Concentrated problems are execution or relationship issues. Spread problems are usually pricing or proposal quality.
- Is your bid rate rising while your win rate falls? That pattern signals pipeline discipline has loosened: your team is bidding more but not more selectively.
- Is your win rate stable but your pipeline shrinking? You are winning a higher share of a smaller market, which looks good until revenue drops.
- Are your count and amount win rates diverging? You are winning small and losing large. Capture investment is misallocated.
Signals and what they mean
ProposalKit's proposal analytics overview notes that proposal-level metrics like section dwell and acceptance rate aggregate into useful structural signals only across many proposals; single-deal engagement data is a deal-level signal, not a portfolio signal. Apply the same logic to win rates: one loss tells you nothing; a pattern across 10+ losses in the same segment tells you something specific.
- Rising bid rate + falling win rate: Tighten go/no-go criteria immediately.
- Stable win rate + falling pipeline: Investigate whether the market has contracted or whether your team has stopped pursuing new clients.
- High count win rate + low amount win rate: Redirect capture resources toward larger opportunities.
- Low win rate on new clients only: Invest in earlier capture engagement before the RFP drops.
GetAccept's proposal analytics research shows that real-time engagement signals (view frequency, time per section) let teams time follow-ups precisely, and that timely follow-ups tied to re-open events materially increase close probability. Track these at the deal level; aggregate them to find structural proposal weaknesses.
Pro Tip: After spotting a low win rate in a segment, pull the last five losses in that segment and check whether you were the incumbent or a new entrant. If you lost as the incumbent, that is a retention problem. If you lost as a new entrant, that is a capture investment problem. The fix is completely different.
How do you improve your proposal win rate after analysis?
Diagnostics tell you where the problem is. This playbook tells you what to do about it, in priority order.
Priority 1: Go/no-go and pipeline hygiene
- Set a minimum Go/No-Go score threshold (e.g., 65 out of 100) and enforce it. Every bid below threshold that your team submits anyway is a loss waiting to happen.
- Remove no-decision and stalled opportunities from your active pipeline monthly. Stale records inflate bid counts and distort rates.
- Require a single, locked pipeline amount field per opportunity before it enters the analysis dataset.
Priority 2: Capture planning
- Start capture at least 90 days before RFP release for any opportunity above your average deal size.
- For incumbent recompetes, document your performance evidence and client relationship contacts before the RFP drops, not after.
- For new client pursuits, identify the evaluation criteria early and map your differentiators to each criterion. RFP evaluation criteria guidance provides a structured approach to this mapping.
Priority 3: Proposal-level fixes
- Build win themes that connect your solution directly to the client's stated priorities, not generic capability statements.
- Compress decision friction: shorten your executive summary, lead with the client's problem, and put your differentiators in the first two pages.
- Review pricing presentation. A technically superior proposal loses on price when the pricing section is hard to read or compare.
Priority 4: Post-submission follow-up and playbook updates
- Within 48 hours of a loss, request a debrief. Document the reason in a standard loss-reason field (price, technical, relationship, scope mismatch).
- After five losses in the same segment, run a structured win-loss analysis to identify the pattern.
- Update your go/no-go criteria and proposal templates based on debrief findings every quarter.
Pro Tip: The 48-hour loss debrief is the highest-ROI activity in proposal management. Most teams skip it. The teams that do it consistently build a loss-reason database that makes every future go/no-go decision sharper.
Worked examples: count-based vs. pipeline-amount calculations
Here is a small sample dataset with five opportunities. Use it to verify your own spreadsheet formulas before scaling to a full pipeline.
Count-based calculations:
- Bids submitted: 4 (A, B, D, E); No-bids: 1 (C)
- Bid rate (count) = 4 ÷ (4 + 1) = 80%
- Wins: 2 (A, D); Losses: 2 (B, E)
- Win rate (count) = 2 ÷ (2 + 2) = 50%
Pipeline-amount calculations:
- Bid pipeline: $500K + $200K + $150K + $600K = $1,450,000; No-bid pipeline: $800,000
- Bid rate (amount) = $1,450,000 ÷ ($1,450,000 + $800,000) = 64.4%
- Won pipeline: $500K + $150K = $650,000; Lost pipeline: $200K + $600K = $800,000
- Win rate (amount) = $650,000 ÷ ($650,000 + $800,000) = 44.8%
The divergence here is instructive. The team won half its bids by count but captured less than half the decided pipeline value by amount. Opp E, a $600K loss, dragged the amount rate below the count rate. Large individual opportunities have outsized leverage on amount-based rates, which is exactly why both measures belong in every analysis.
What KPIs and dashboard layout should you track?
A well-structured dashboard surfaces problems before they become revenue shortfalls. These are the core KPIs and the layout that makes them actionable.
Core KPIs to track
- Bid rate (count and amount): Measures pipeline discipline and pursuit selectivity.
- Win rate (count and amount): The primary performance indicators; track both every period.
- Pipeline-weighted win rate: Win rate weighted by opportunity value; the most revenue-relevant single number.
- Average opportunity value: Tracks whether deal size is shifting; a falling average often precedes a revenue gap.
- Bid volume by segment: Total bids per client, type, or PM per period; catches volume drops before they hit rates.
- Time-to-decision: Average days from submission to award/loss notification; long cycles inflate in-progress counts and distort period rates.
Suggested dashboard layout
| Widget | Data Shown | Update Frequency |
|---|---|---|
| Trended win rate chart | Count and amount win rates, quarterly | Weekly |
| Bid rate by segment table | Bid rate (count/amount) per client or PM | Monthly |
| Top-variance segments | Segments with largest deviation from average | Monthly |
| Recent wins/losses table | Last 20 decided opportunities with rates | Weekly |
| Pipeline-weighted win rate | Single KPI tile | Weekly |
Threshold guidance
Flag any segment where win rate drops more than 10 percentage points below your portfolio average for two consecutive quarters. That threshold triggers a structured diagnostic review, not just a note in a standup. Tie dashboard reviews to your weekly capture/proposal standup: spend the first five minutes on the trended chart, then move to the top-variance segment table. Teams that review rates weekly catch adverse trends in one quarter; teams that review annually often discover problems after the revenue impact has already landed.
What data quality issues bias bid win rate calculations?
Bad data produces confident-looking wrong answers. These are the most common problems and how to fix them.
Common pitfalls
- Miscounting no-bids: If no-bid decisions are not logged as formal records, your bid rate is artificially inflated. Every passed opportunity needs a no-bid record with a decision date and pipeline value.
- Inconsistent pipeline fields: Using "estimated value" for some records and "contract ceiling" for others creates a mixed denominator. Pick one field; document it; enforce it.
- Changing opportunity IDs: When a re-competed contract gets a new ID, it looks like a new opportunity. Track the predecessor ID to preserve continuity in incumbent analysis.
- Small-sample noise: A segment with fewer than 10 decided opportunities in a period produces rates that swing wildly. Aggregate to a longer window before drawing conclusions, consistent with guidance on sample size and rate stability.
- Ties and split awards: Count a split award as 0.5 wins for count-based rates, per winning percentage conventions. For amount-based rates, record only the portion of the contract value actually awarded to your firm.
- Withdrawn bids and cancelled solicitations: Remove these from both numerator and denominator. They are not decided contests and distort rates if left in.
Monthly data audit checklist
- Confirm every no-bid decision from the prior month has a logged record with a decision date.
- Verify the pipeline amount field is consistent across all new records.
- Check for duplicate opportunity IDs from re-competed or modified contracts.
- Flag any segment with fewer than 10 decided opportunities and note it as low-confidence in reports.
Pro Tip: Assign one person to own the monthly data audit. Shared ownership means no ownership. A 30-minute monthly audit by a dedicated analyst prevents the kind of data drift that makes six months of trend data unusable.
What experienced practitioners actually look at first
The formulas are straightforward. The discipline is not.
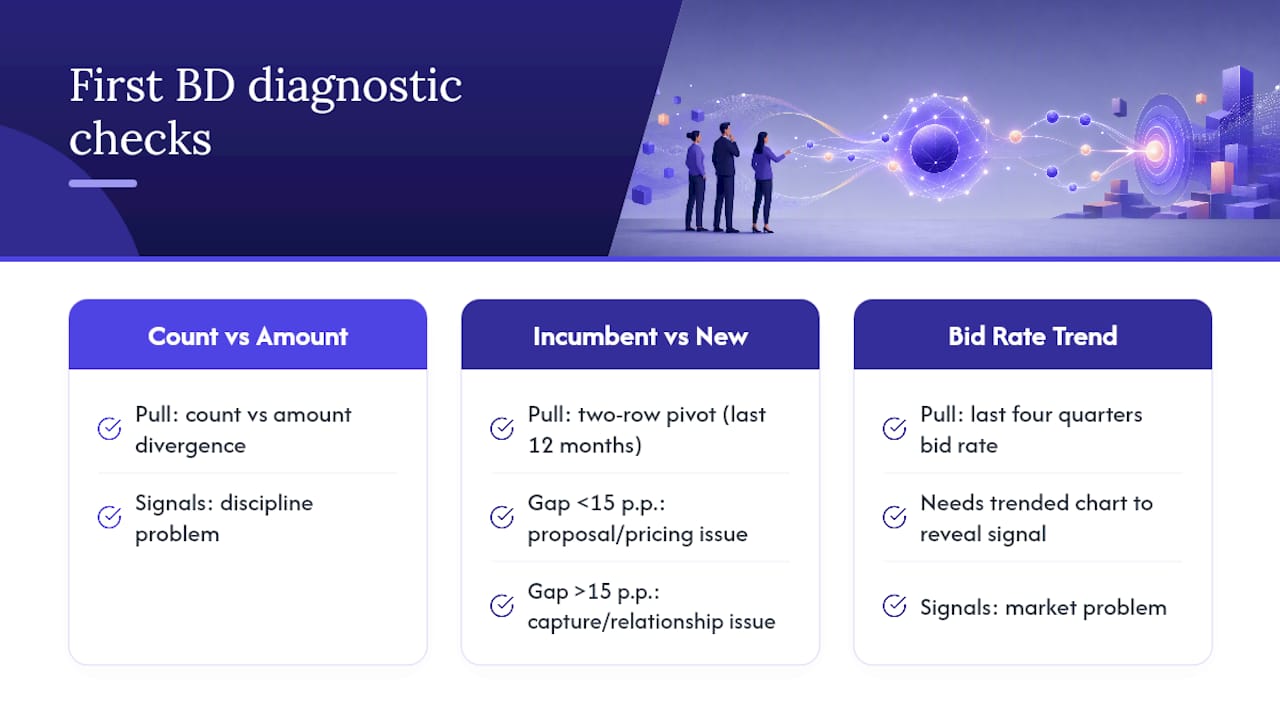
When I pull rates for a BD team, the first three checks are always the same: the count vs. amount divergence, the incumbent vs. new client split, and the bid rate trend over the last four quarters. Those three numbers together tell you whether the team has a discipline problem, a relationship problem, or a market problem — and each one points to a completely different fix.
The diagnostic that changes minds most often is the incumbent recompete rate. Teams routinely assume they will win their recompetes because they know the client. That trend, invisible without a trended chart, is the signal that a key client relationship is eroding before the next RFP even drops.
One shortcut that saves time: before building a full segmented table, run a quick two-row pivot — incumbent vs. new — for the last 12 months. If the gap is less than 15 percentage points, your problem is probably proposal quality or pricing, and you can focus improvement effort there. If the gap is larger than 15 points, the problem is capture investment and relationship depth, and no amount of proposal editing will close it.
Rfpforgeai puts your proposal analytics to work immediately
Tracking rates manually in spreadsheets works until it does not. The moment your pipeline grows past 30 active opportunities, the audit burden outpaces the insight.
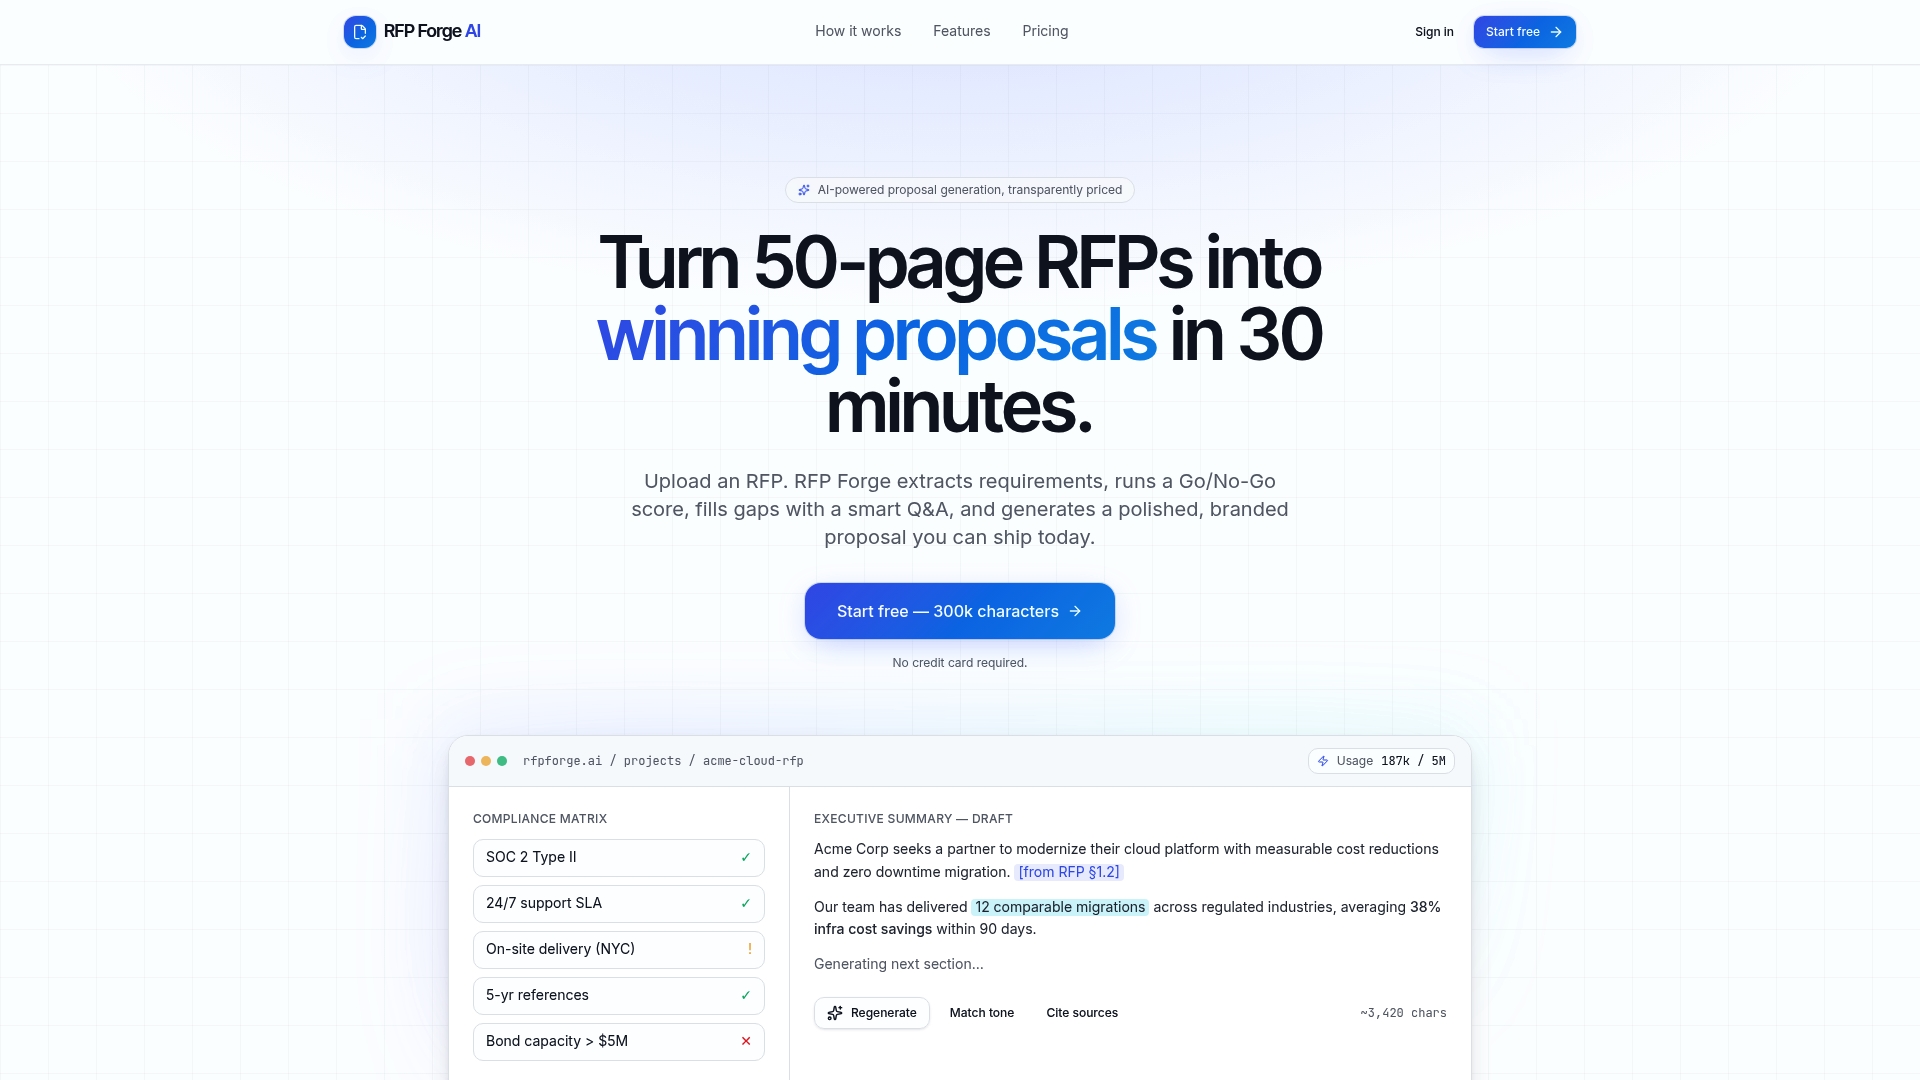
Rfpforgeai combines win-rate analytics with AI-powered proposal generation in a single platform, so the data that informs your go/no-go decisions is the same data that feeds your proposal drafts. The platform automatically extracts RFP requirements, builds a compliance matrix, and flags gaps through an interactive Q&A, cutting the time from RFP receipt to polished draft to 30 minutes. Your analytics and your proposal workflow live in the same place, which means your win-rate findings translate directly into proposal adjustments without a manual handoff.
For BD teams that want to stop treating analytics and proposal generation as separate workstreams, Rfpforgeai is the platform that connects them. Start generating winning proposals and track your win rates from the same dashboard.
Sources
These references support the formulas, table definitions, and implementation steps covered in this guide.
- Bid Rate Analysis Table
- Proposal analytics: the metric set that turns tracking into a decision | ProposalKit
- 7 ways to boost close rates with proposal analytics